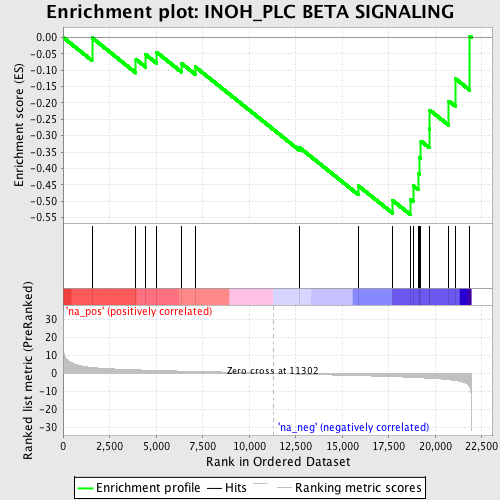
Profile of the Running ES Score & Positions of GeneSet Members on the Rank Ordered List
| Dataset | set01_ATM_minus_versus_SCID |
| Phenotype | NoPhenotypeAvailable |
| Upregulated in class | na_neg |
| GeneSet | INOH_PLC BETA SIGNALING |
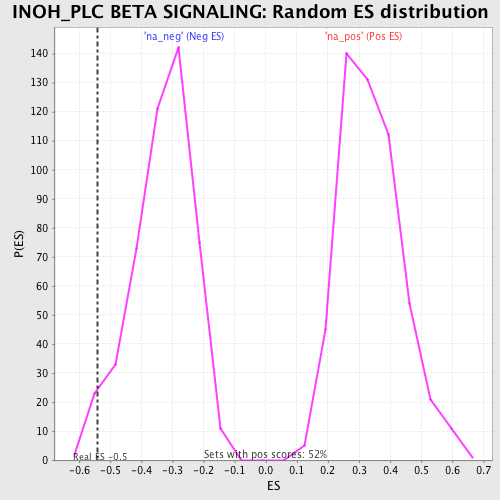
| Enrichment Score (ES) | -0.54080456 |
| Normalized Enrichment Score (NES) | -1.6296824 |
| Nominal p-value | 0.020833334 |
| FDR q-value | 0.37519017 |
| FWER p-Value | 0.999 |
| PROBE | GENE SYMBOL | GENE_TITLE | RANK IN GENE LIST | RANK METRIC SCORE | RUNNING ES | CORE ENRICHMENT | |
|---|---|---|---|---|---|---|---|
| 1 | PRKCA | 1554 | 3.257 | -0.0011 | No | ||
| 2 | PRKCQ | 3914 | 1.954 | -0.0668 | No | ||
| 3 | PLCB1 | 4441 | 1.786 | -0.0525 | No | ||
| 4 | ARAF | 5031 | 1.595 | -0.0452 | No | ||
| 5 | PRKCZ | 6358 | 1.249 | -0.0789 | No | ||
| 6 | PRKCI | 7102 | 1.072 | -0.0898 | No | ||
| 7 | MAP2K1 | 12682 | -0.417 | -0.3353 | No | ||
| 8 | PRKCH | 15876 | -1.279 | -0.4535 | No | ||
| 9 | GNAQ | 17710 | -1.822 | -0.4981 | Yes | ||
| 10 | ITPR1 | 18648 | -2.183 | -0.4940 | Yes | ||
| 11 | MAPK3 | 18809 | -2.253 | -0.4531 | Yes | ||
| 12 | BRAF | 19077 | -2.378 | -0.4143 | Yes | ||
| 13 | PRKCD | 19153 | -2.418 | -0.3659 | Yes | ||
| 14 | PLCG1 | 19227 | -2.460 | -0.3165 | Yes | ||
| 15 | PLCB3 | 19683 | -2.699 | -0.2795 | Yes | ||
| 16 | MAP2K2 | 19707 | -2.715 | -0.2223 | Yes | ||
| 17 | RAF1 | 20726 | -3.476 | -0.1943 | Yes | ||
| 18 | ITPR3 | 21081 | -3.940 | -0.1260 | Yes | ||
| 19 | PRKCE | 21859 | -7.723 | 0.0040 | Yes |